| Legal Information |
|

The Overall ROI Calculation tab, shown partially below, sums out all the other information input into the spreadsheet's two source tabs and gives the ROI estimate. The only data point this tab asks you for is Discount Rate Factors; this field is at the far right-hand side of the tab (the input cell is shaded blue).

Effectively, the discount rate is the figure the spreadsheet uses to determine how much the funds you project to earn or save five years from now are worth in today's terms; after all, the client is being asked to invest heavily now, so you need to be able to compare apples to apples. This is known as discounted cash flow.
For the purposes of this oversimplified tool, only one criterion - the rate of compounded interest to be expected on held funds - in our discount rate calculations. Some discount rate computations include far more sophisticated standards, such as presumed inflation and even risk of project failure, but for our purposes, we decided to leave such advanced computations to the accountants.
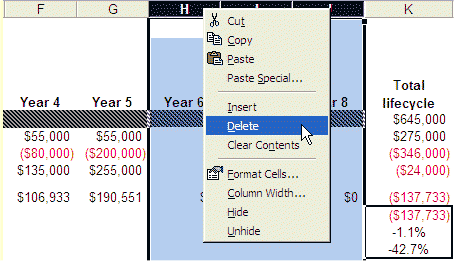
The only other action you need to take on this tab is to delete any unused year columns in the timeline projection for the proposal.
Unlike the other tabs in the spreadsheet, the present value functions in the Overall ROI Calculation spreadsheet assume that a blank column is a year in your timeline; if you put in data for years 1 through 5 but leave in the columns for years 5 through 8, the spreadsheet will discount the figures for eight years. Just right-click on the column header for any unused years and select Delete, as shown below.

The spreadsheet takes it from there. As you can see from the first figure, the project is a pretty huge winner; of course, gross cost-savings of more than $1 million were projected and a slow but steady increase of revenue over eight years. The Investment, Increase/(dec.) in revenue, Increase/(dec.) in operational expenses, and Gross Cash Flow rows sum up the values from the spreadsheet's source tabs and report those unadjusted numbers.
The magic really happens in the PV of Cash Flow row, which adjusts your financial projects based on the Discount Rate you enter (we used the fairly standard 6 percent, which is probably a safe bet for you, too). As you can see, the $121,000 gross positive cash flow we projected for the first year of our project has a present value of $114,151; by the eighth year of the proposal, $355,000 in gross gains is worth only $222,731 in today's money.
In column K, you can see the overall key values of Present Value, Internal Rate of Return, and ROI for the proposal. Our sample project is such a winner that its ROI is 156.6 percent.
| Search Knowledge Base | Feedback |